Cattle Bep Beta Endorphin Elisa Kit
Cow beta Endorphin (bEP) ELISA Kit is an ELISA kit for the in vitro quantitative measurement of Cow beta Endorphin (bEP) concentrations in serum, plasma, cerebrospinal fluid and other biological fluids. This assay has high sensitivity and excellent specificity for the detection of beta-endorphin (bEP)
No cross-reactivity or significant interference between beta-endorphin (bEP) and analogs was observed.

Stability
The stability of the kit is determined by the rate of loss of activity. The loss rate is less than 5% within the expiration date under proper storage conditions. To minimize performance fluctuations, operating procedures and laboratory conditions must be strictly controlled. It is also strongly recommended that the entire assay be performed by the same user.
Test principle
This kit is based on competitive enzyme-linked immunosorbent assay technology. An antibody is pre-coated onto a 96-well plate. Standards, test samples, and biotin-conjugated reagent are added to the wells and incubated. A competitive inhibition reaction takes place between the biotin-labeled bEP and the unlabeled bEP on the pre-coated antibody. The HRP-conjugated reagent is then added and the entire plate is incubated. Unbound conjugates are removed using wash buffer at each step. The TMB substrate is used to quantify the enzymatic reaction of HRP. After adding the TMB substrate, only wells containing sufficient bEP will produce a blue-colored product, which then changes to yellow after adding the acid stop solution. The intensity of the yellow color is inversely proportional to the amount of bEP bound to the plate. OD is measured spectrophotometrically at 450nm in a microplate reader, from which the concentration of bEP can be calculated.
Calculation of results
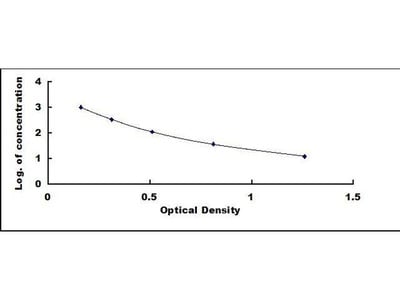
This assay is competitive, so there is an inverse correlation between the concentration of bEP in the sample and the measured absorbance. Create a plot with the log of the standard concentration (y-axis) and the measured average absorbance (x-axis). Apply a best-fit trend line through the standard points. The bEP concentration of the samples can be interpolated from the standard curve.
